The aim of this phase was to perform some integration tests of the hardware built over the past two months - and hopefully prove that the system is capable of performing astronomical operations. Components which are integrated into the system are listed below:
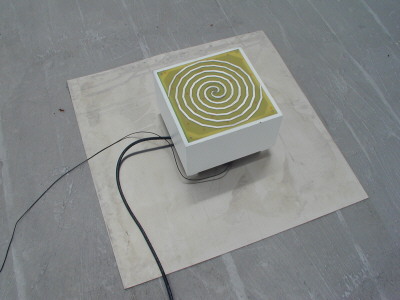
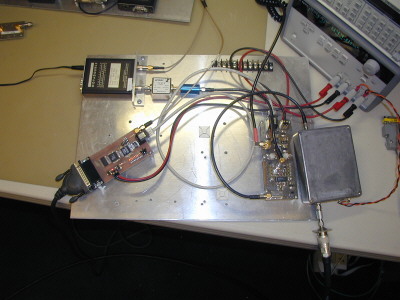
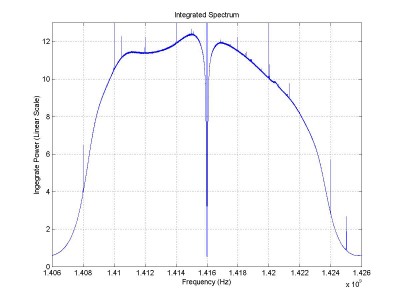
The following two photographs illustrate the system components. The spiral antenna is located on the ESL roof top and connected via a 20metre length of RG9U cable. The received signal is first bandlimited to 200MHz (centred around 1420MHz) and then input to the complex receiver. The LVDS output is then fed to the parallel port LVDS receiver. Here blocks of up to 256k samples can be captured and downloaded to a host PC.
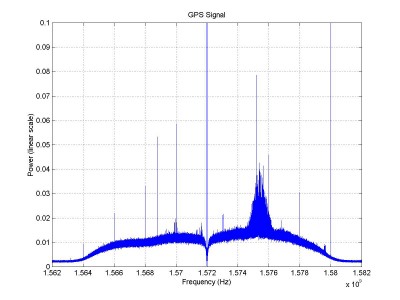
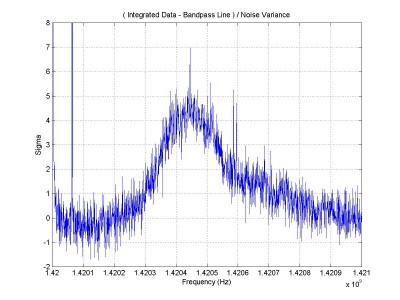
Within the complex receivers 1-2GHz band lie two known signals of interest:
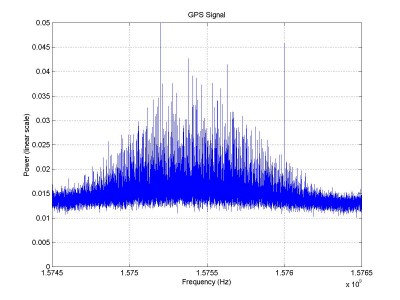
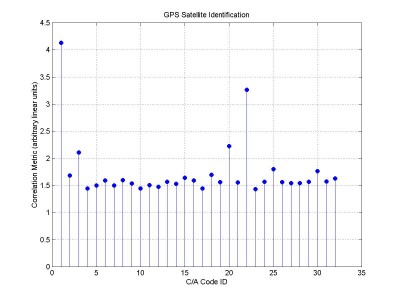
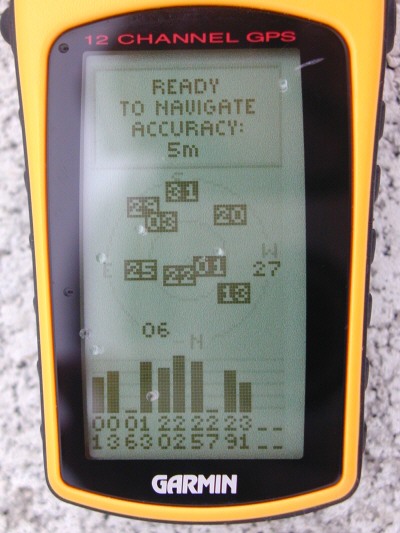
Well its one thing to see spectra - but were we actually receiving GPS? Steve decided to further analyze the collected data to see if we could extract which GPS satellites we were receiving at that instant. There are only 32 possible C/A codes - each containing a stream of 1024 symbols. Since the satellites are moving with respect to the receiver we also tested for doppler shifts in the range of plus/minus 4.5kHz (in 100Hz steps). The results of the best correlations are shown in the graph below. The results indicate that we were receiving signals from GPS satellites 1, 3, 20, 22, 25 and 30. I also made a photograph of my GPS receiver minutes after recording the data set. The two satellites which are overhead (1 and 22) have the strongest correlations and the remainder also have matching, but weaker correlations. A very good result considering the antenna has 100 degree field of view, and the aircondition unit was partially obscurring the field of view on one side.
With the success of these measurements an eight antenna system will constructed in November. Stay tuned for more astronomical results!