Detection of a narrowband radio point source in the vicinity of NGC 752
Russell K. Childers
On October 26, 2009, at 03:56 UTC, the Ohio Argus Array detected a
brief (<2 s), narrowband (<10 Hz) radio pulse centered on 1420.8807 MHz.
The Argus Array processor analyzing the narrowband data in real-time
determined the signal source to be at right ascension 01 h 52 m 00s (+/- 11 m),
declination +37d 00m (+/-2.5 d).  These coordinates and error bars put
the open cluster NGC 752 (RA 01 h 57 m 55s; dec +37 d 51 m 57 s; 1,300 ly)
within the field of view of the array (HPBW = 5 d, at zenith).  The source
makes an excellent match to an ideal beam calculated from the array geometry,
making it highly unlikely that the source is a false alarm caused by local
or receiver noise.  Five-minutes-worth of data were archived at the time
of detection, triggered by the ideal-beam-match.  Analysis of ephemerides indicate
no known artificial radio sources within the HPBW of the Ohio Argus Array
at the time of detection.

For more information on Argus see:

Argus: An L-Band All-Sky Astronomical Surveillance System

This paper appears in: Antennas and Propagation, IEEE Transactions on
Publication Date: Feb. 2008
Volume: 56,  Issue: 2
On page(s): 294-302
ISSN: 0018-926X
INSPEC Accession Number: 9794152
Digital Object Identifier: 10.1109/TAP.2007.915467
Current Version Published: 2008-02-07
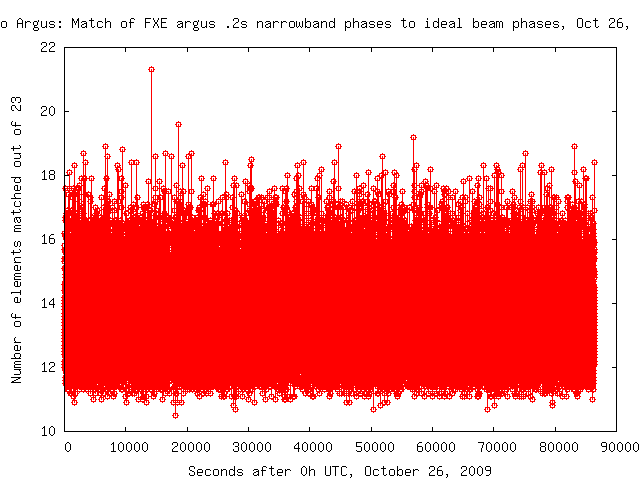
Figure 1. Match criterion for narrowband sources, for Oct 26, 2009.
A match of 21.5 elements out of 23 indicates a far-field source.
The source detection occurred at 14160 seconds after 0 h UTC.
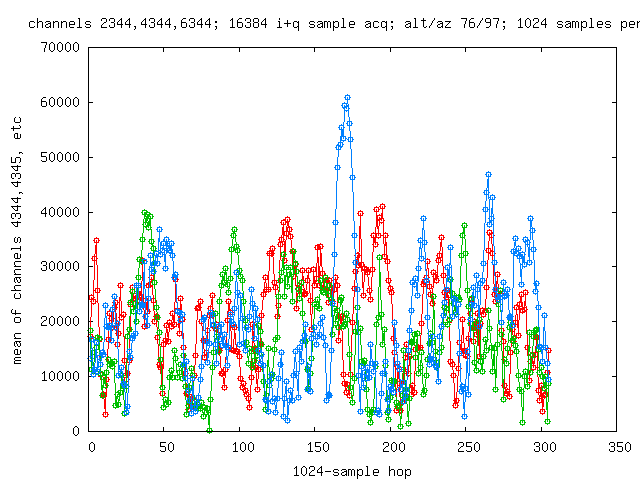
Figure 2. Power in frequency bins over 5-minute data archive period.
Data were from a synthesized beam pointing in the direction of the source.
red = 1420.8707 MHz; blue = 1420.8807 (source); green = 1420.8907 MHz)
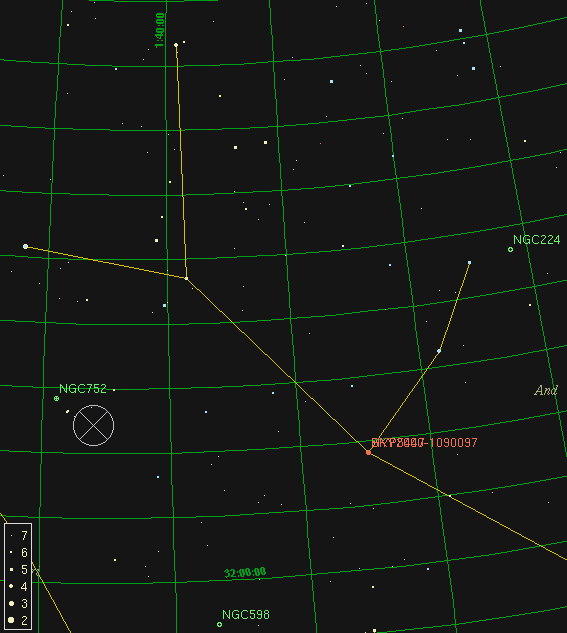
Figure 3. Plot of source location with respect to known astronomical objects.
Note the proximity of NGC 752.
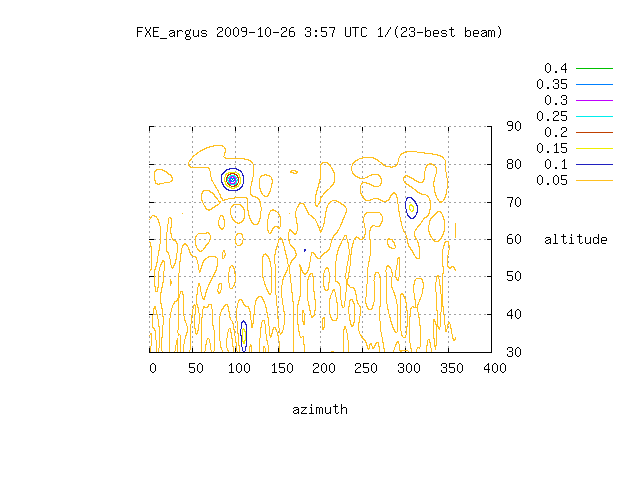
Figure 4. Contour plot of 1/(23-deal_beam_match). This is generated
by doing a least-squares match between the phases of each ideal beam
and the phases of the source frequency bin from each array element.
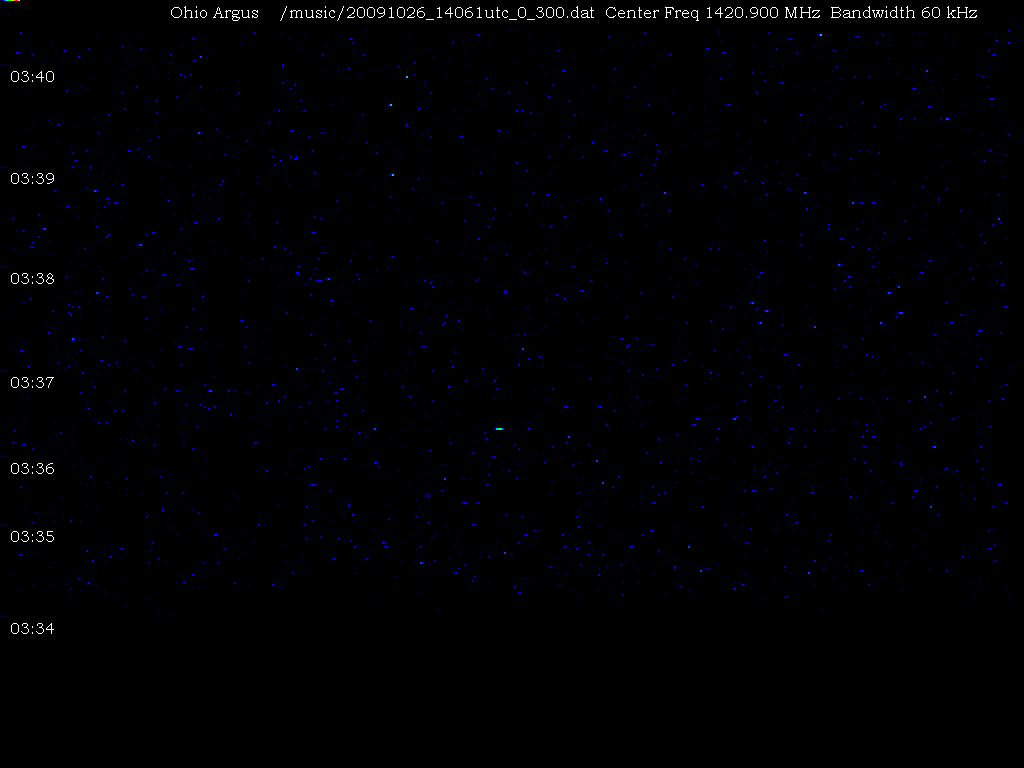
Figure 5. Closeup of waterfall of beam pointed at source location.
Bottom of image is October 26, 2009 03:54 UTC; top is 03:59 UTC.
Spectra consist of 500 5-Hz channels each. Spectra are aligned to be
centered on source center frequency (1420.8807 MHz). Ignore the time
stamps on the left-hand margin of the Figure.
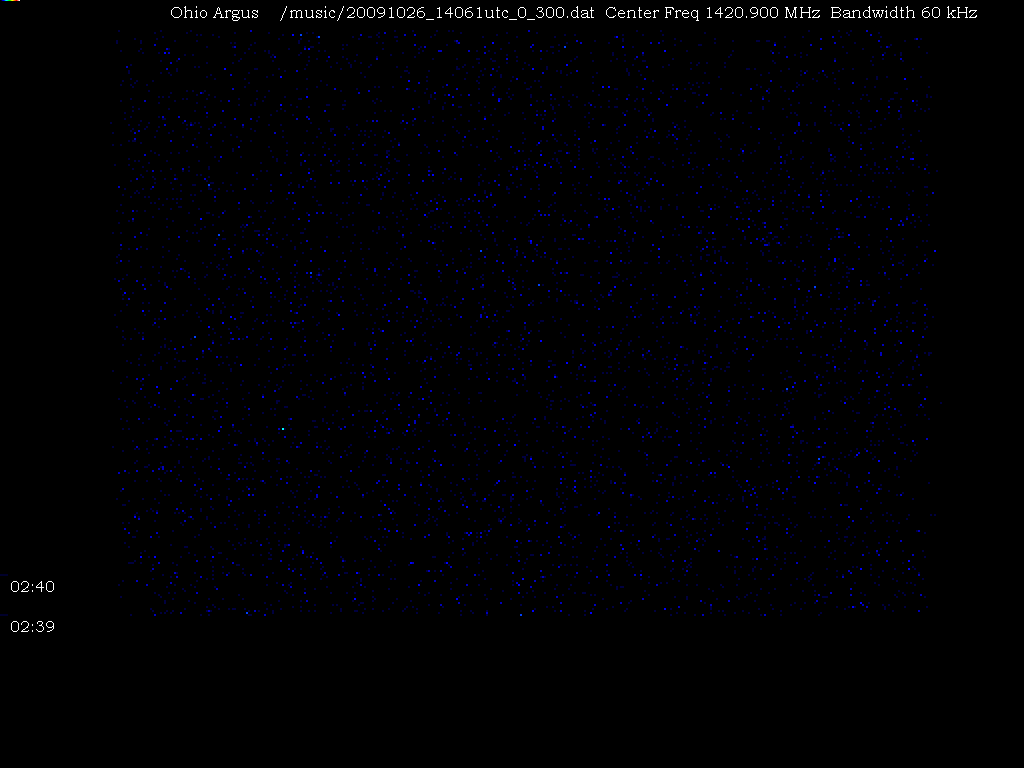
Figure 6. Full 60 kHz of waterfall of beam pointed at source location.
Bottom of image is October 26, 2009 03:54 UTC; top is 03:59 UTC.
Spectra consist of 500 channels (max of every 6 channels) each.
The source shows up as a single pixel, 2/3 of the way down the image,
1/4 of the way over from the left-hand side. Ignore the time stamps
on the left-hand margin of the Figure.
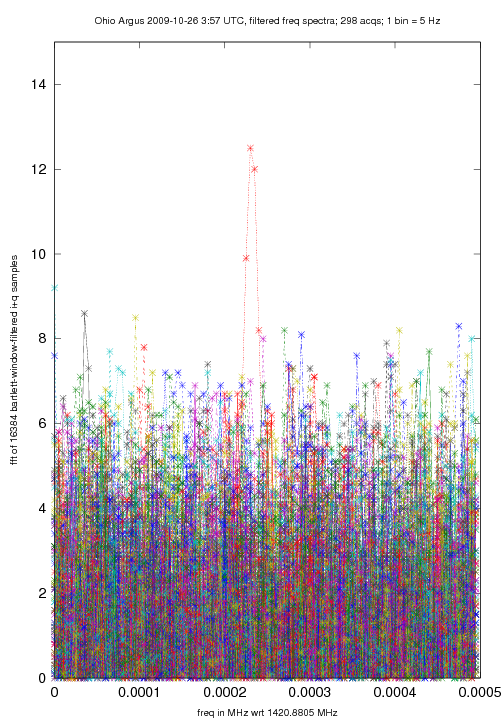
Figure 7. This is a plot of Figure 5, where frequency bin power is
shown across all 298 archived acquisitions.
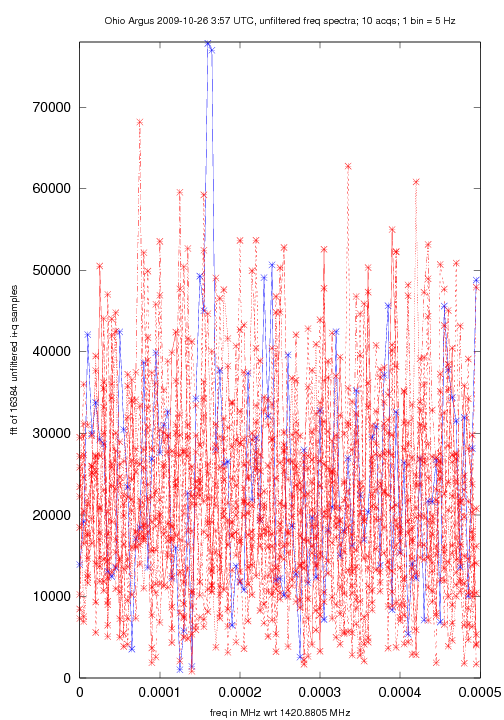
Figure 8. FFTs of unfiltered synthesized beam spectra, pointed
at source location. Ten spectra are shown: 5 before source event
and 4 after source event (all in red), and the source event itself,
in blue.